
Wellness Insights
Read mood, energy, stress and workload trends, understand who can see what, and review wellness alerts for people who may need support.
On this page
Wellness Insights turns daily mood check-ins into trends. Each check-in records a mood score and, when it is made in the app, scores for energy, stress and workload, all from 1 to 5. The page shows how those scores move over a month and, for admins, flags people whose scores have stayed low.
Open it from the sidebar: under Time & Reports, select Wellness Insights. It is on every plan. The same page also charts punctuality.
Who can see what
| Admins | Members and team leads | |
|---|---|---|
| Averages and charts | The whole company’s check-ins | Only your own check-ins |
| Attendance | The whole company | Only your own |
| Wellness Alerts | Yes, naming people | Not shown |
| members checked in progress bar | Yes | Not shown |
At the top of the page a button shows Admin view for admins or Only your data for everyone else. Select it to open Who sees what, which says:
- Admins: “Team averages, attendance, and alerts that name people whose scores stay low.”
- Members: “Only their own check-ins and attendance, never a teammate’s scores.”
The rules behind this are:
- Check-ins are not anonymous. Every entry is stored against the person who submitted it, and admin alerts show that person’s name.
- Team leads get no extra view. Only company admins see other people’s wellness data. See Roles and permissions.
- Entries that Asa estimates itself are left out of admin views. When a person has not logged a mood, Asa can record an estimate of it from their workday. Admin averages, charts, distributions and alerts only use entries that people submitted themselves.
- Admin charts are company-wide. There is no team filter on this page, and no way to chart one person other than yourself.
- Alerts include a short note preview. If a person added a note to their latest check-in, the alert shows the first 120 characters of it and its date.
Choose a month
Use the arrows beside the month name to move to the previous or next month. You cannot go past the current month. Each score compares the month on screen with the month before it.
If the month has no data, the page says “No wellness data for this month yet” and “Trends will appear here once check-ins come in for mood, energy, stress or workload.”
Read the four scores
The tiles at the top show the month’s average for each score, with a small trend line.
| Score | What 5 means | Better is |
|---|---|---|
| Mood | Great | Higher |
| Energy | High energy | Higher |
| Stress | High stress | Lower |
| Workload | Heavy workload | Lower |
A mood of 1 is Rough, 2 is Low, 3 is Okay, 4 is Good and 5 is Great. Averages weight each day by how many people checked in, so a day with ten check-ins counts for more than a day with one. A tile with no data says No check-ins.
Next to each average, a change such as “+0.3” or “−0.2” compares it with the previous month. Hover it to see “vs” and the month. Green means better, red means worse, and No change means the difference is under 0.1. Because lower is better for stress and workload, a fall in those is green.
Under the tiles, one sentence names the score to watch: “{Score} is the area to watch this month at {value}/5.” It picks the score furthest from the good end of its scale.
Check-ins made by tapping the mood buttons in Slack, Teams or Telegram record only mood. Energy, stress and workload come from check-ins made in the app, or from Asa when you describe them.
Follow trends over the month
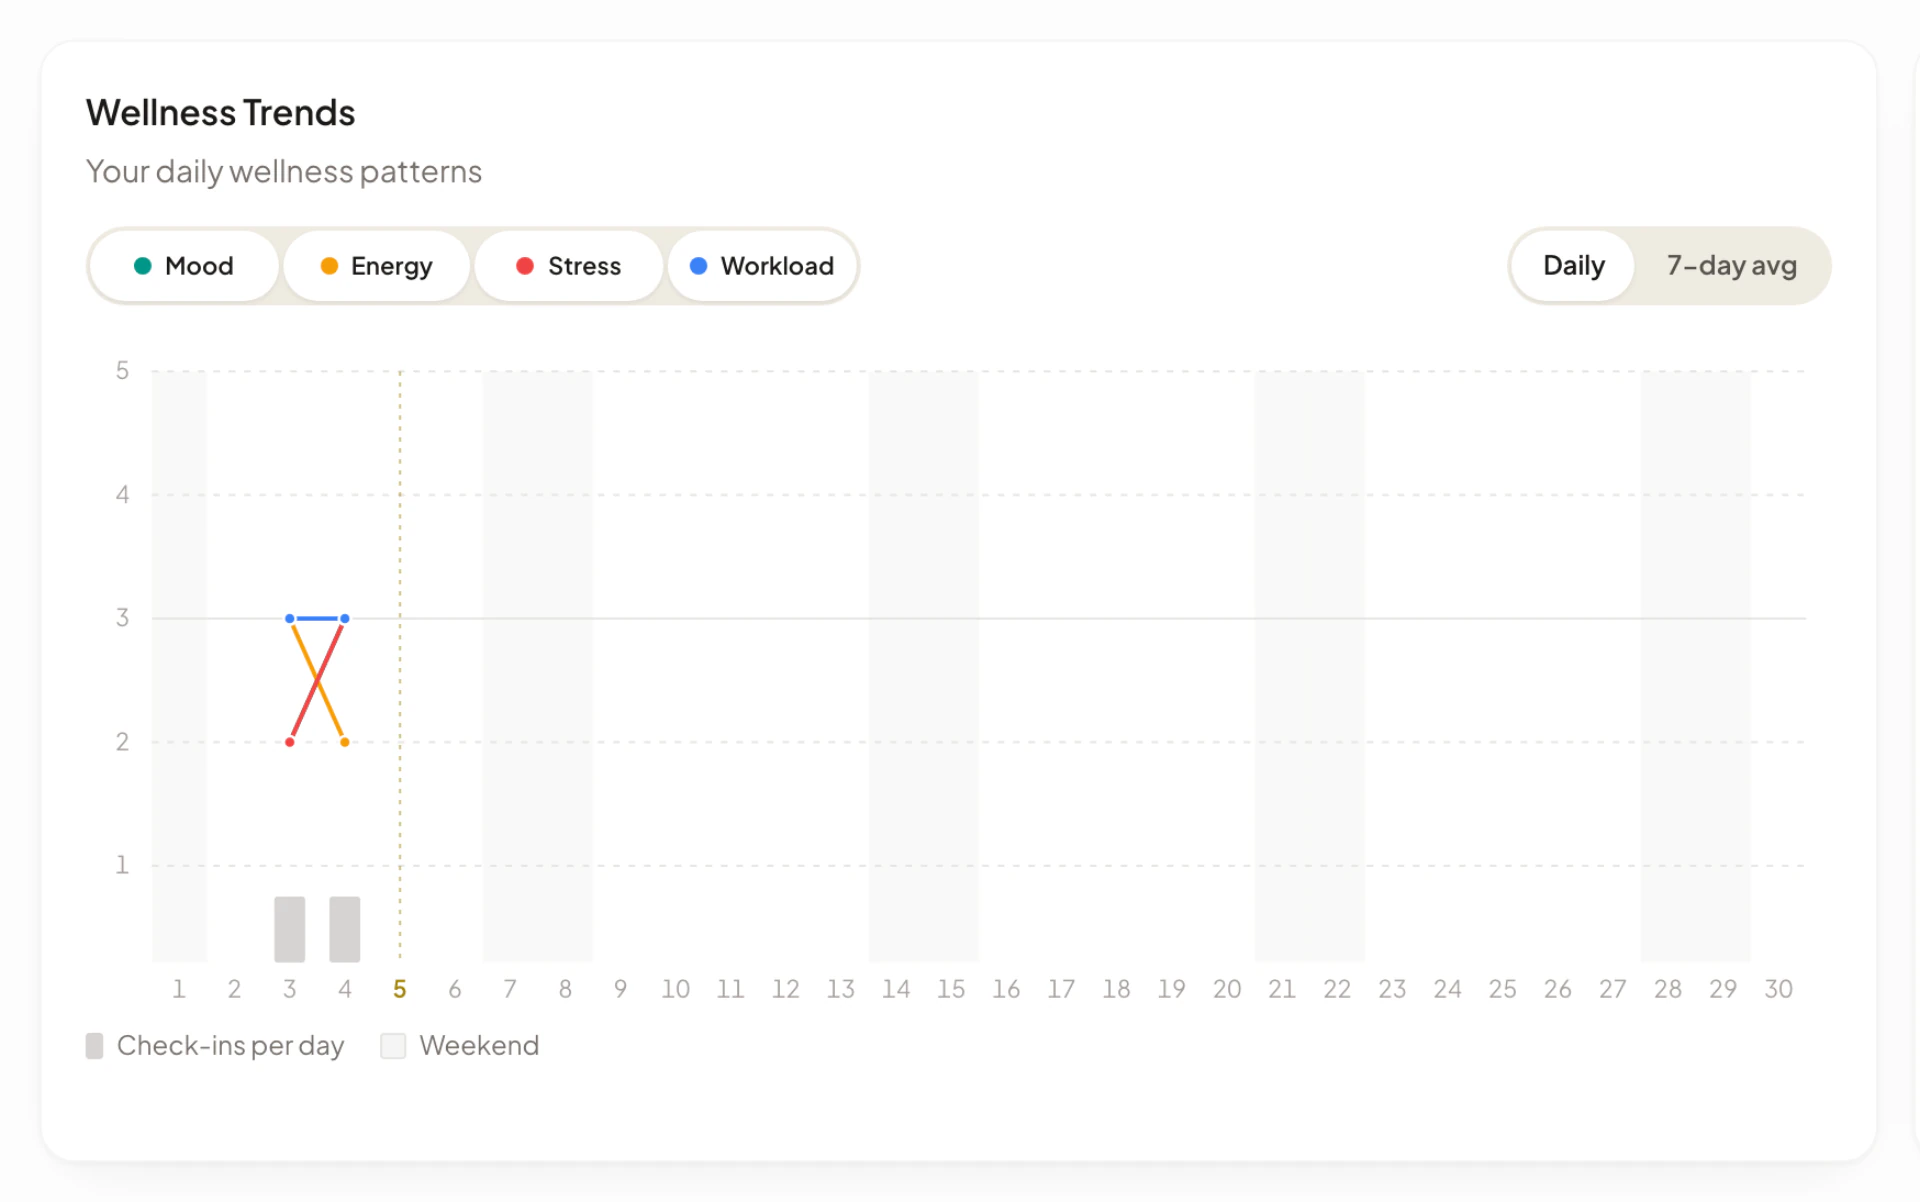
Wellness Trends draws a line for each score across the days of the month. Admins see “Team mood, energy, stress & workload over time”. Members see “Your daily wellness patterns”.
- The score buttons above the chart turn each line on or off. With none selected, all four show.
- Daily and 7-day avg switch between each day’s values and a 7-day rolling average. In 7-day mode the faint dots keep the daily values.
- Hover over a day, or focus the chart and use the arrow keys, to see that day’s scores and “Check-ins: {number}”.
- The bars at the bottom show Check-ins per day. Weekends are shaded and today has a dashed marker.
- Admins also see members checked in with a bar, for example “4 / 12”. It counts people who checked in this month.
See the month at a glance
Month at a glance is a calendar where each day is shaded by that day’s average: “Daily average, darker is higher”. Pick a score with the buttons above it. The row under the calendar, Average by weekday, gives each weekday’s average. When there are at least three weekdays with data and the best and worst differ by 0.3 or more, the page adds Best: {day} and Toughest: {day}. For stress and workload, the best day is the lowest.
Check the response spread
Response spread shows, for each score, the share of check-ins at each value from 1 on the left to 5 on the right. Each bar also shows “Responses: {number}” and the average, for example “Avg 3.4”. Until check-ins come in, it says “Score breakdowns appear once check-ins come in.”
Compare hours with wellbeing
Hours and wellbeing plots the average hours worked each day against one score. Choose the score with the buttons above the chart. Days that average 9 hours or more are shaded darker. When there are at least two such days and two other days with data, a line spells out the difference, for example “On days averaging 9h or more, stress averaged 3.4, against 2.8 on other days.” If no hours were tracked, it says “No hours tracked this month.”
Review wellness alerts
Wellness Alerts is for admins. It lists “Team members who may need extra support or check-ins”, with a count such as “2 flagged”. When nobody is flagged it says “No alerts right now.”
A person is flagged when their latest check-ins run in a row at the concerning end of a score, two or more in a row:
| Flag | Concerning end |
|---|---|
| Low Mood | Mood of 1 or 2 |
| High Stress | Stress of 4 or 5 |
| Low Energy | Energy of 1 or 2 |
| High Workload | Workload of 4 or 5 |
Each flag shows its streak, for example “Low Mood · 3-day streak”. People with the longest streaks are listed first. For each person the alert shows four averages for the 7 days up to their latest check-in (“Scores average the 7 days up to each person’s latest check-in”). A score is highlighted when mood or energy is below 3, or stress or workload is above 3. A dash means there were no entries.
Where else admins see flags
- On the Dashboard, Needs Attention can list a person’s flag as Low Mood, High Stress, Low Energy or Overloaded (the High Workload flag above), or “{number} wellness flags active” when there are several. It looks at the last 7 days.
- When someone logs a mood in the app and has had two or more days in a row at the concerning end, admins who are linked to Slack, Microsoft Teams or Telegram get a message titled “Wellness Alert: {name}”. It lists the flags, such as “Low mood (2 days)”, and says “Consider reaching out to offer support.” It follows the admin’s Feature alerts setting under Profile > Notifications. See Notifications.
Ask Asa about the trends
Admins see Summarize team wellness trends at the top of the page once the report has loaded. Select it to ask Asa for a summary of this month’s mood averages, workload and the people who may need attention.