Analytics · all-in-one

Insights that drive
better decisions.

Transform time-tracking and wellness data into actionable insights. Beautiful visualizations, automated reports and AI-powered analytics to keep your team healthy and productive.

Live dashboardOne-click CSV exportPrivacy-first wellness
Analytics dashboard
What's inside

Patterns at a glance,
reports in a click.

From automatic timesheet reports to interactive charts and proactive wellbeing alerts — Asa turns the data your team already generates into decisions you can act on.

01
Timesheet reports

Reports that write themselves.

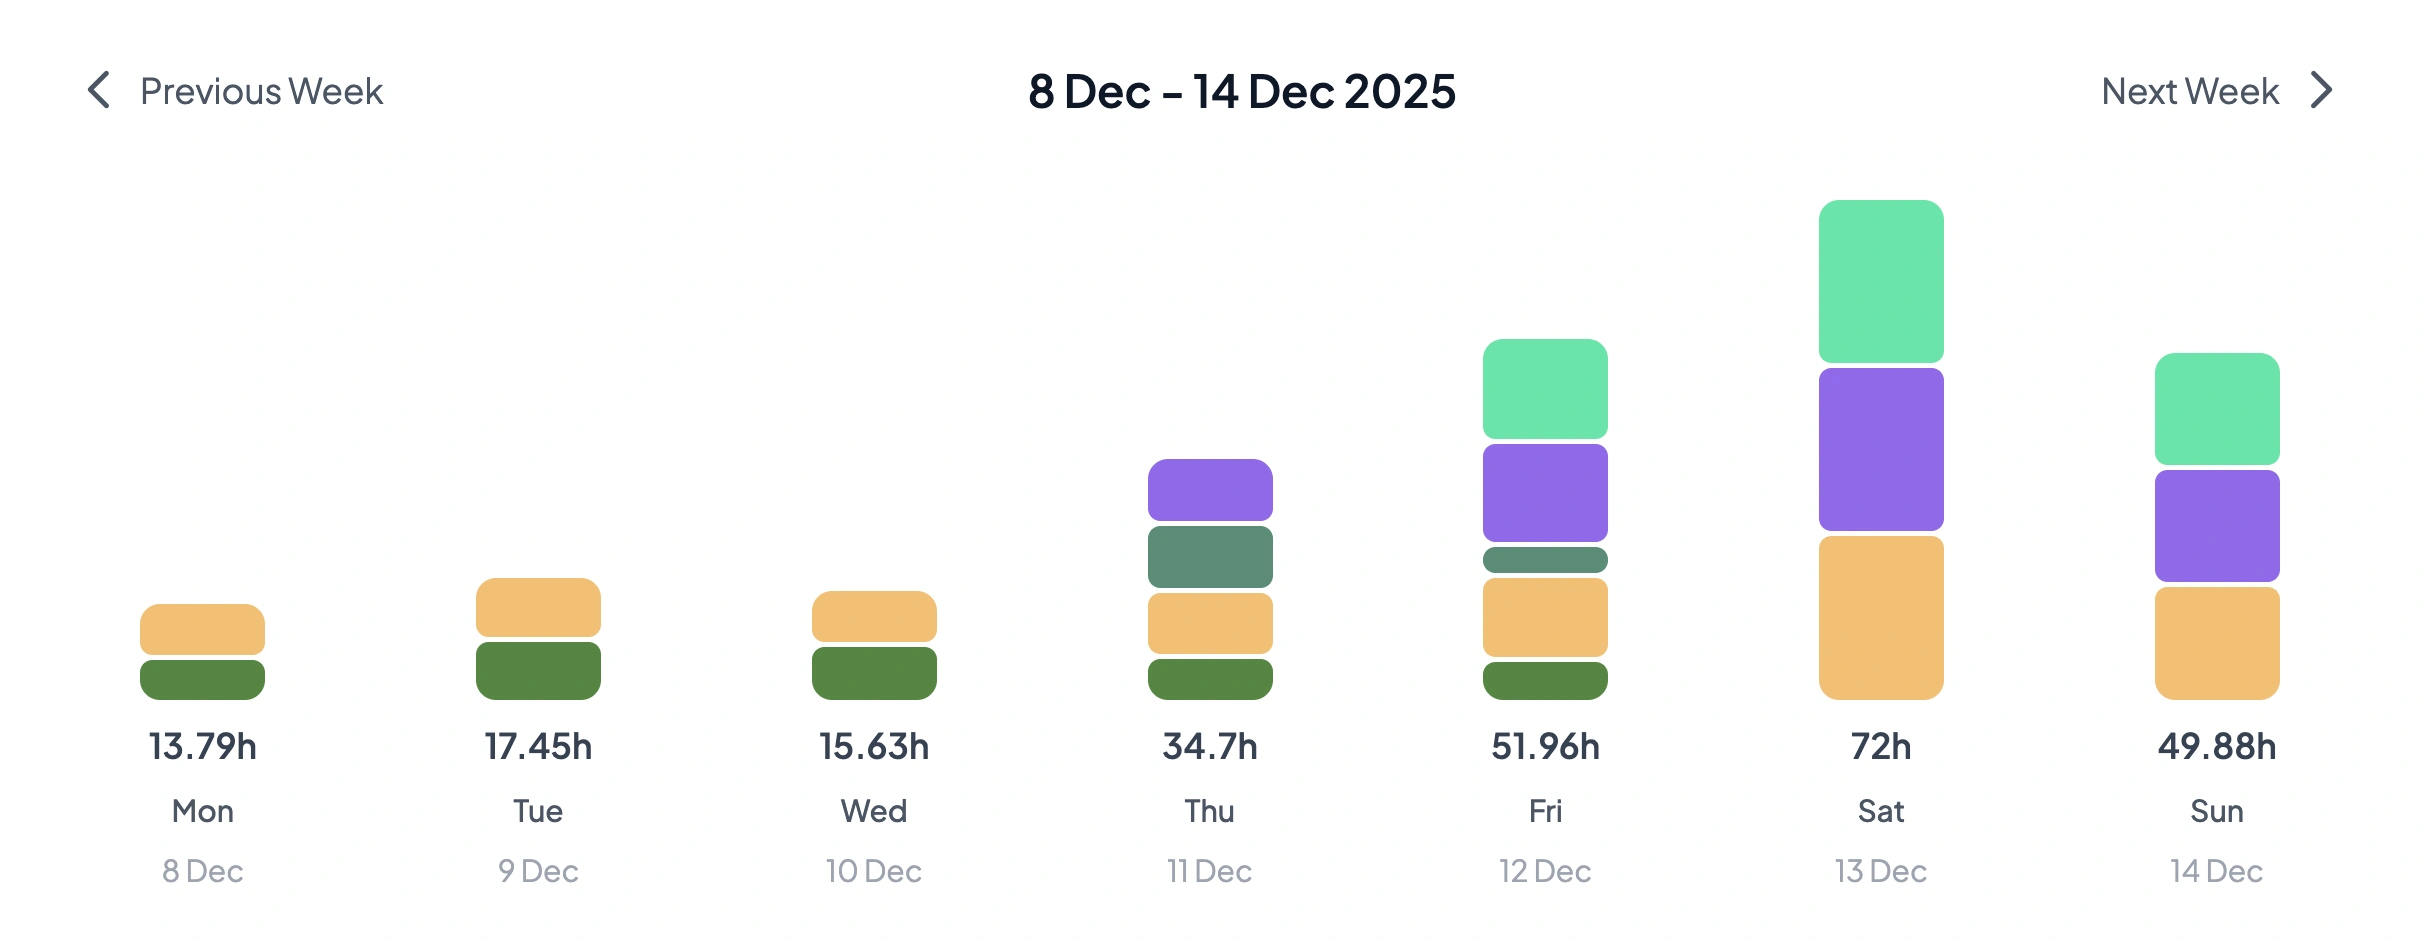
Automatically generated monthly reports show hours worked, punctuality rates and attendance trends. Export daily, weekly or monthly timesheets as CSV with one click — ready for payroll and compliance.
Timesheet reports
Wellness insights
02
Wellness insights

Wellbeing trends, privately.

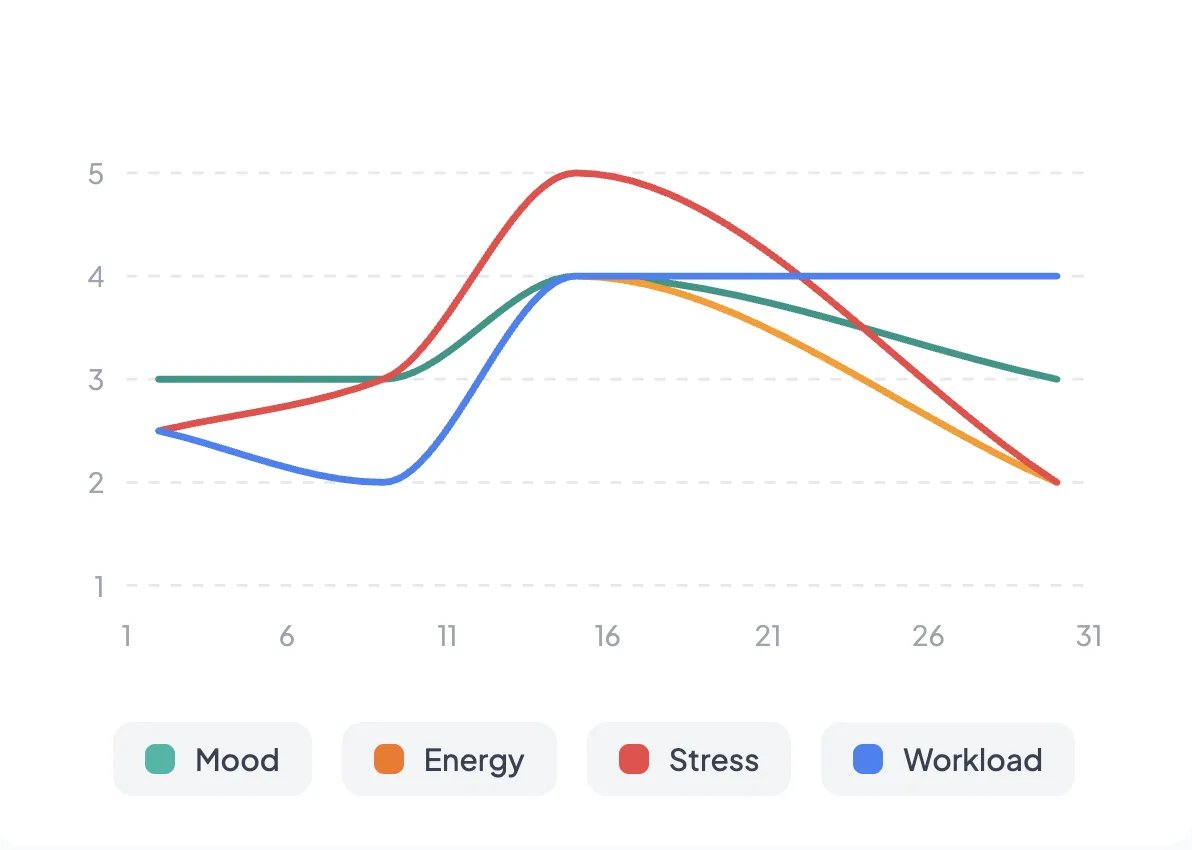
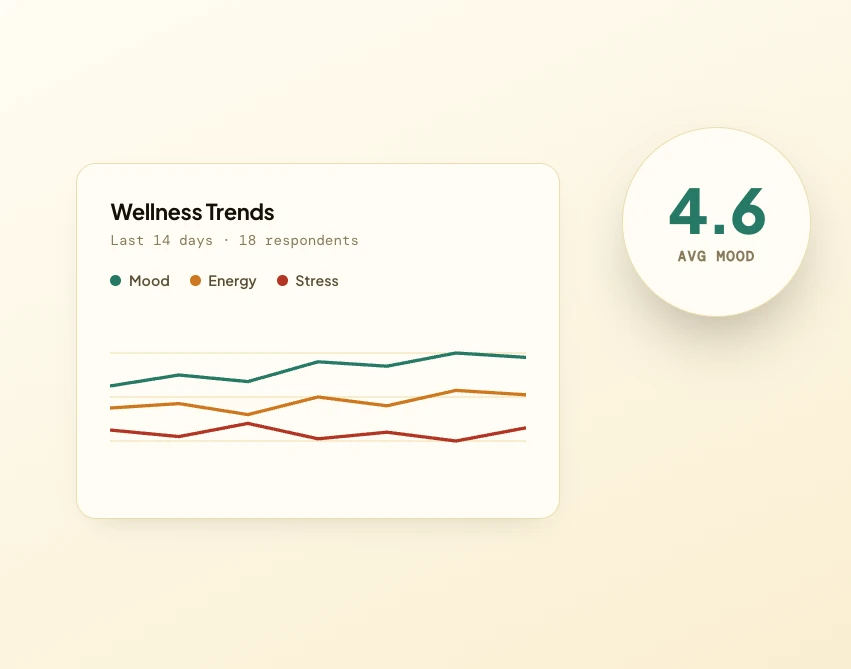
Track team mood, energy, stress and workload with 7-day rolling analytics. AI burnout detection flags at-risk members before issues escalate — with privacy-first, aggregated data for admins.

03
Visualizations

Beautiful charts that reveal patterns.

Bar and line charts surface patterns at a glance. Compare daily hours, track mood trends across the month and visualize punctuality, with toggle-able chart types and drill-down.

Visualizations
Team alerts
04
Team alerts

Proactive nudges, not dashboards to babysit.

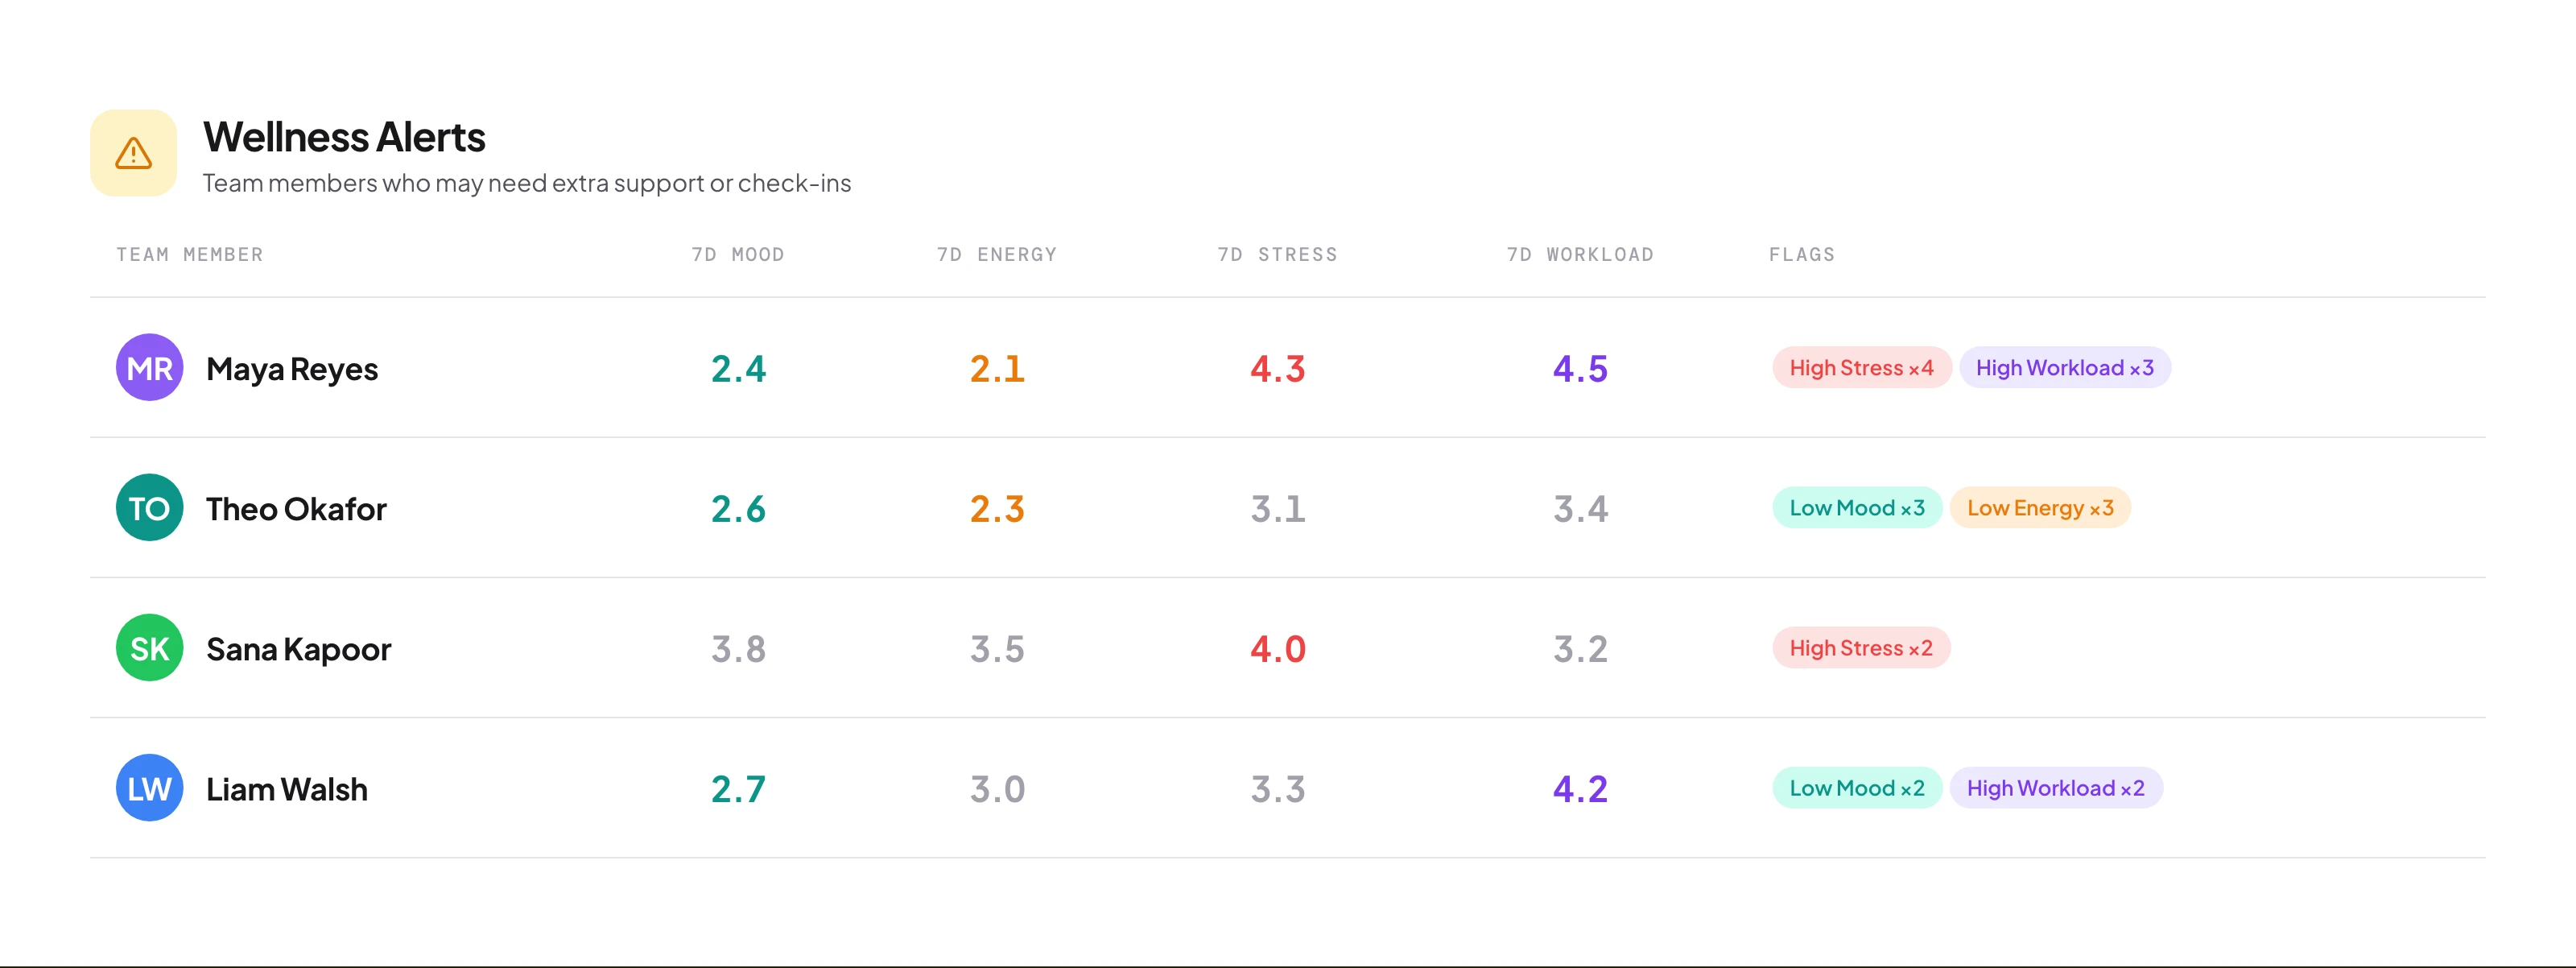
Get alerts for wellness concerns — consecutive low-mood days, high-stress streaks, low-energy patterns. The admin dashboard surfaces members needing support with 7-day summaries and follow-up notes.

Perfect for small teams

Start free with up to 5 team members. No credit card required.

Analytics FAQ

Good to know.

What does the dashboard show?+

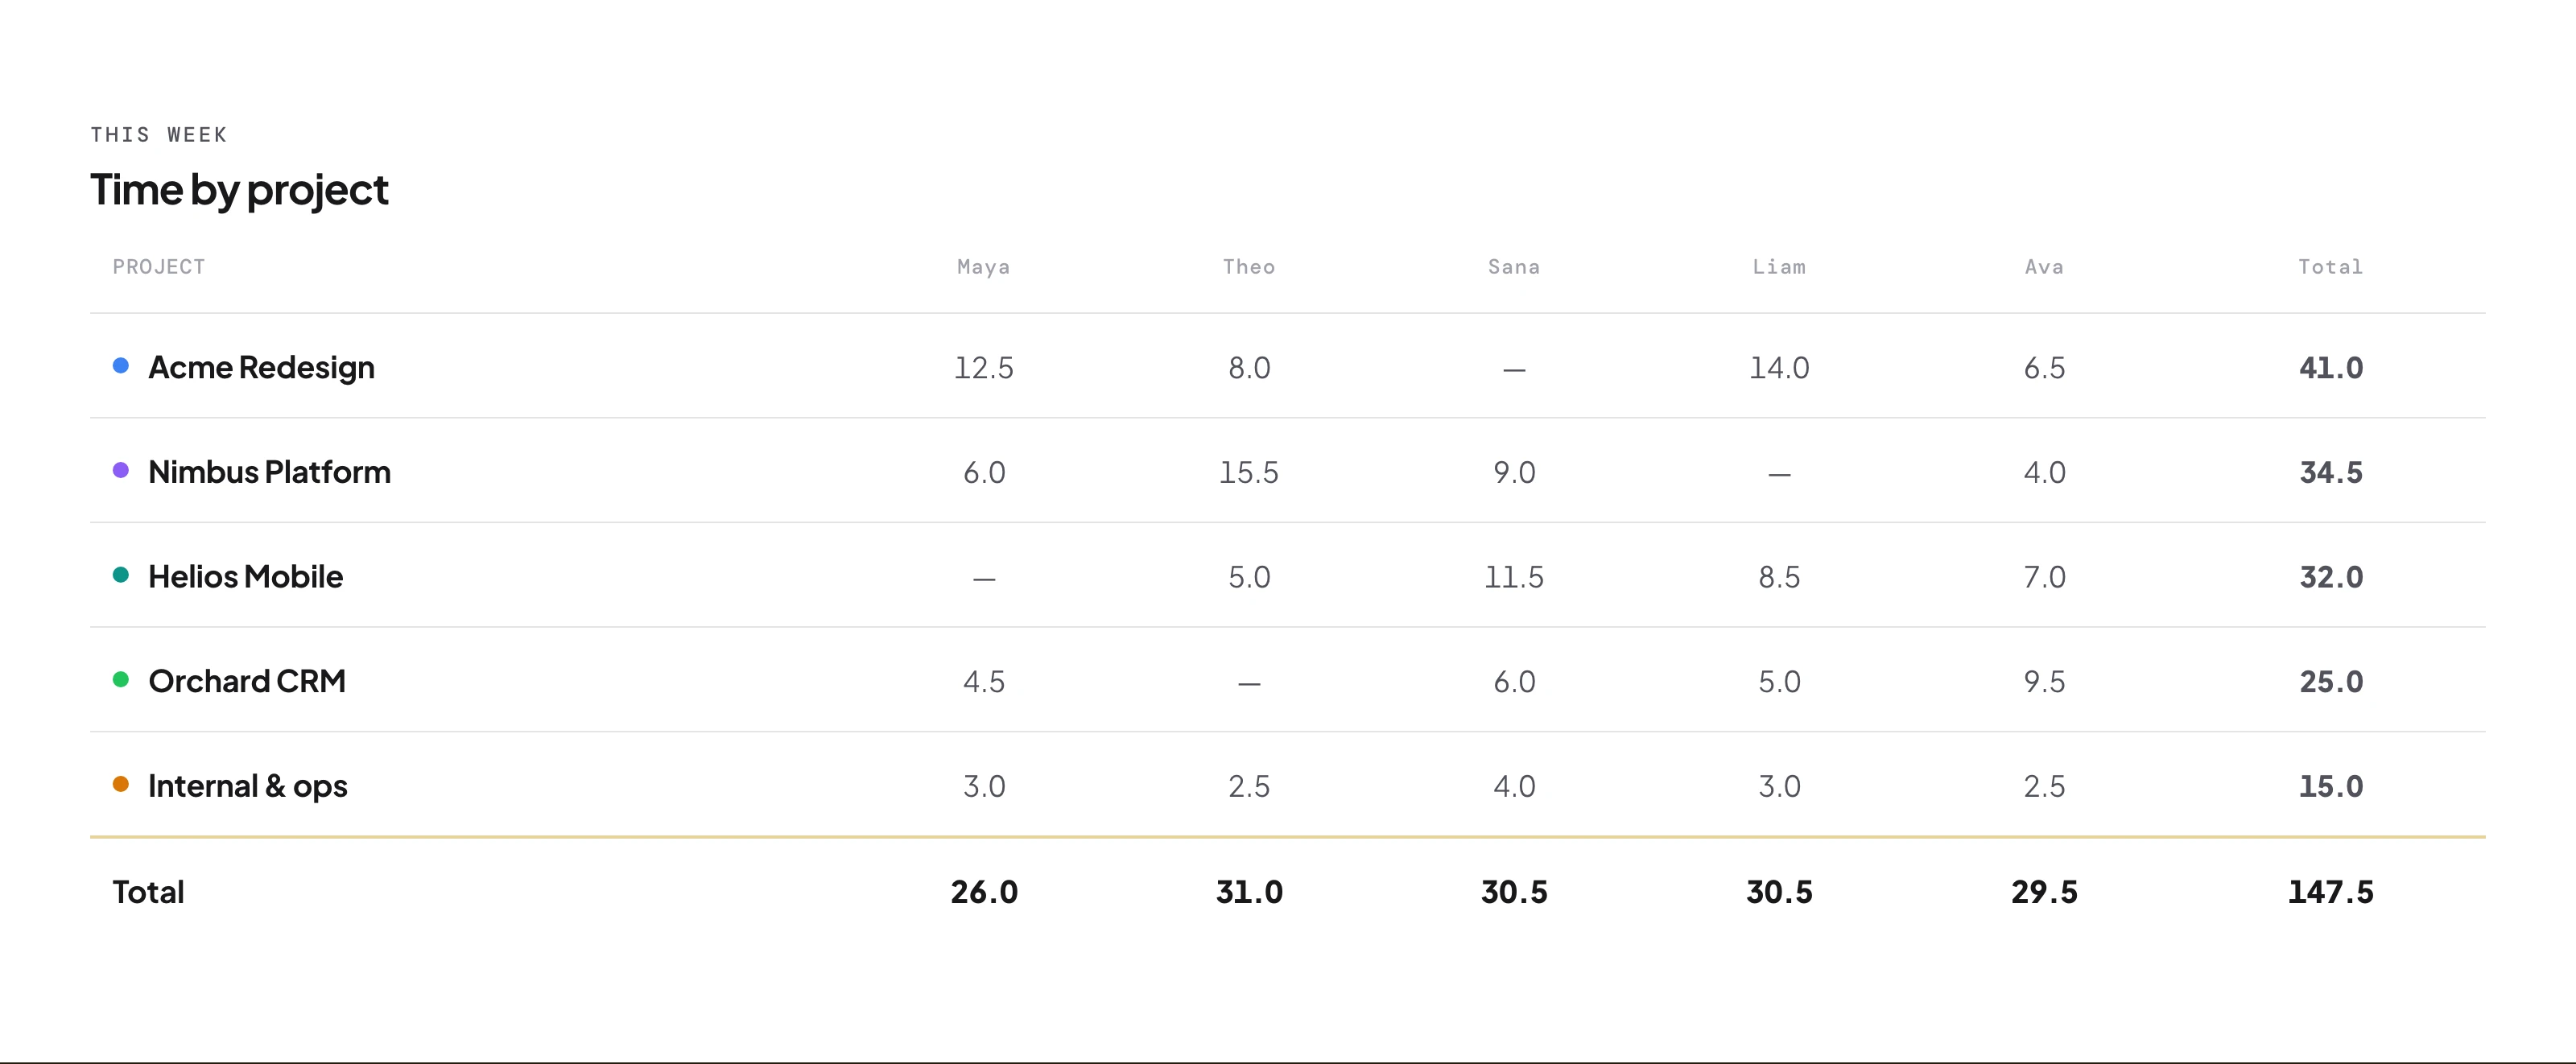
Real-time stats including today's total team hours, team size, active members and on-time percentage — plus wellness trends, project breakdowns, leave status and pending amendments.

What chart types are available?+

Bar charts for daily hours and line charts for mood and wellness trends. Charts are interactive — toggle types and drill into specific periods for detailed analysis.

Can I export analytics data?+

Yes. Timesheet data exports as CSV with one click — daily, weekly or monthly, filtered by member and date range, ready for payroll, client billing or compliance.

How does wellness analytics work?+

It tracks mood, energy, stress and workload using 7-day rolling averages, showing aggregate scores and flagging members who may need support based on concerning patterns.

What are wellbeing alerts?+

When the AI detects patterns like consecutive low-mood days or high-stress streaks, it surfaces those members on the admin dashboard with 7-day summaries and space for follow-up notes. Growth and above.

Can non-admins access analytics?+

Members view their own attendance and timesheets. Team-wide analytics, wellness alerts and aggregate reports are admin-only to maintain privacy and appropriate access.

How does project hour visualization work?+

Donut charts show how team hours distribute across active projects — a quick visual breakdown of where time goes without running separate reports.

What punctuality metrics are tracked?+

On-time percentages based on scheduled clock-ins and configurable grace periods — individual and team-wide rates, late patterns and attendance trends over time.

Are analytics free?+

Basic analytics — the dashboard, timesheet reports and CSV exports — are on all plans. Advanced features like AI wellness alerts and burnout detection require Growth or above.

How do I access the dashboard?+

It's the default landing page when you log in, automatically showing stats for your role — admins see team-wide data, members see their personal attendance summary.

Free for small teams · No credit card

Make the data work for you.

Your dashboard is ready the moment you sign in — team hours, punctuality, project breakdowns and wellbeing trends. Basic analytics free on every plan.

Live dashboardOne-click CSV exportFree on every plan